
题目
Figure 2 shows a plot of part of the curve with equation with being measured in radians.
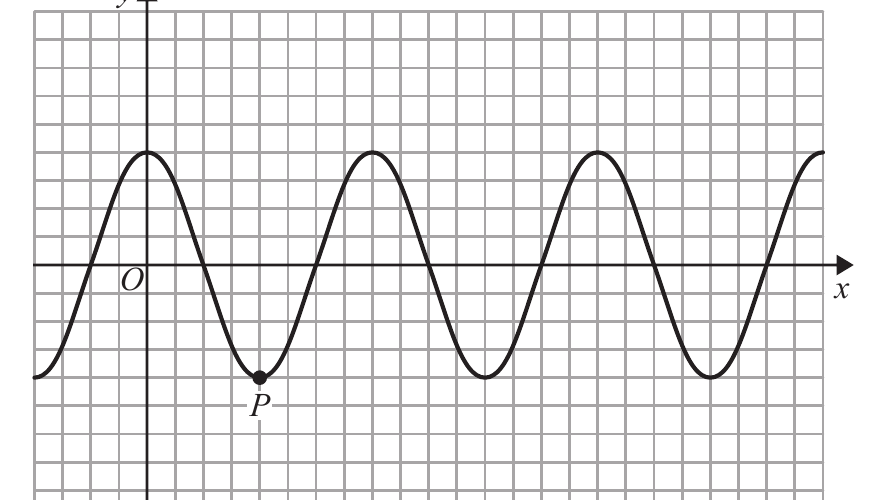
The point , shown on Figure 2, is a minimum point on the curve.
(a) State the coordinates of .
A copy of Figure 2, called Diagram 1, is shown at the top of the next page.
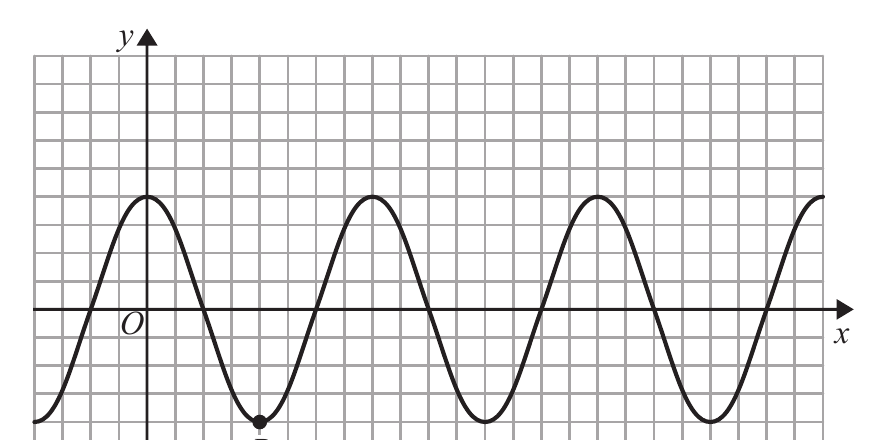
(b) Sketch, on Diagram 1, the curve with equation .
(c) Hence, or otherwise, deduce the number of solutions of the equation
(i) that lie in the region ,
(ii) that lie in the region .
解答
(a)
解法一
思路
展开
第一次取最小值 时,,所以 。
答题过程
展开
(b)
解法一
思路
展开
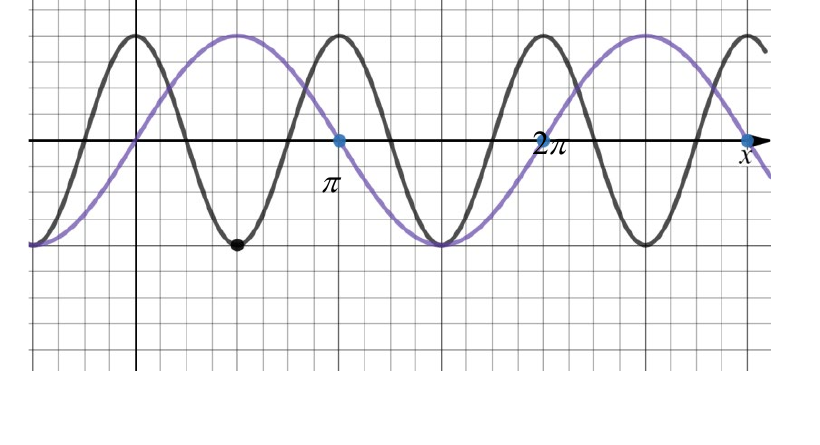
经过原点,最大值为 ,最小值为 ,周期为 。
答题过程
展开
The sketch of should pass through the origin, have maximum value , minimum value , and period .
(c)
解法一
思路
展开
从一段 的图像可数出 个交点。 是 个完整周期; 在此基础上再多半个周期。
答题过程
展开
In , there are solutions.
For ,
so the number of solutions is
For , the extra interval adds more solutions, so the number of solutions is