题目
Problem
Figure 4 shows a sketch of the curve with equation
y=tanx,−2π≤x≤2π.
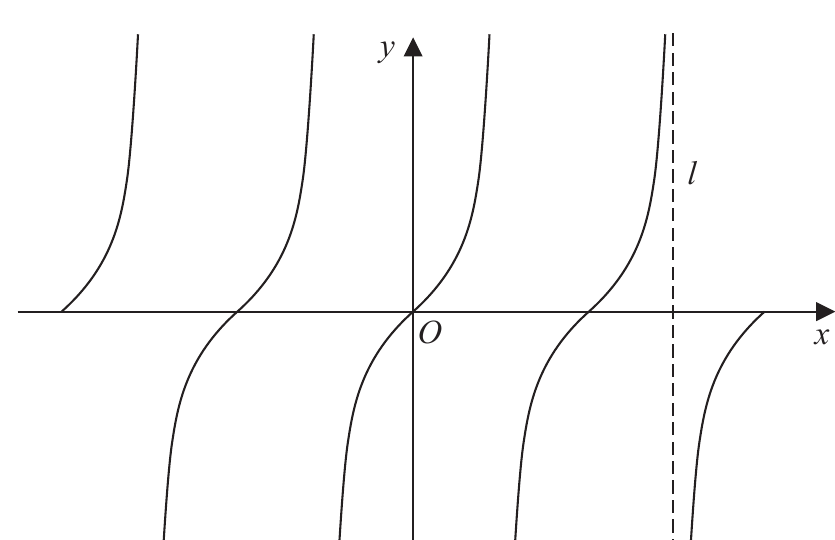
Figure 4
The line l, shown in Figure 4, is an asymptote to y=tanx.
(a) State an equation for l.
(1)
A copy of Figure 4, labelled Diagram 1, is shown on the next page.
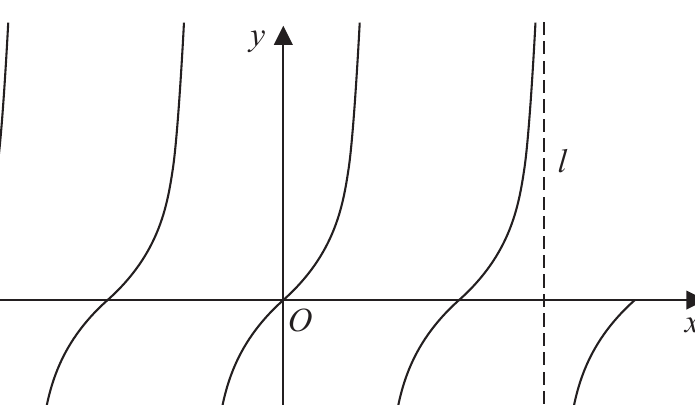
Diagram 1
(b)
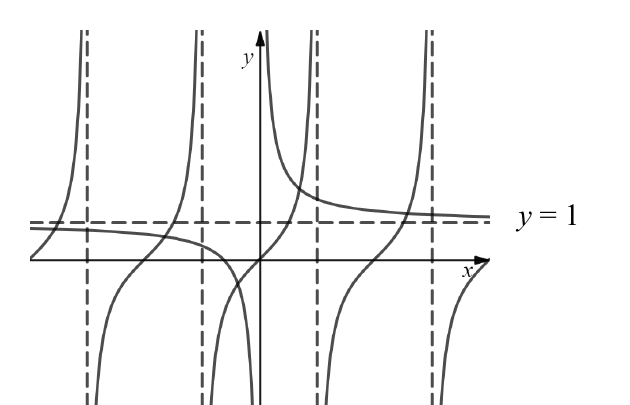
(i) On Diagram 1, sketch the curve with equation
y=x1+1,−2π≤x≤2π,
stating the equation of the horizontal asymptote of this curve.
(ii) Hence, giving a reason, state the number of solutions of the equation
tanx=x1+1
in the region −2π≤x≤2π.
(4)
(c) State the number of solutions of the equation tanx=x1+1 in the region
(i) 0≤x≤40π,
(ii) −10π≤x≤25π.
(2)
解答
(a)
解法一
思路
展开
tanx 的竖直渐近线在 x=2π+nπ。图中标出的右侧渐近线是 x=23π。
答题过程
展开
An equation for l is
x=23π.
(b)
解法一
思路
展开
y=x1+1 是 reciprocal 图像上移 1。所以竖直渐近线是 x=0,水平渐近线是 y=1。方程的解就是两张图像的交点个数。
答题过程
展开
For
y=x1+1,
the horizontal asymptote is
y=1.
The sketch should show two reciprocal branches with vertical asymptote x=0 and horizontal asymptote y=1.
The number of solutions of
tanx=x1+1
is the number of intersections of the two graphs. From the sketch on −2π≤x≤2π, there are
5
solutions.
(c)
解法一
思路
展开
在正半轴上,每个长度为 π 的 tangent 分支与 y=x1+1 有一个交点。负半轴区间要结合图像分支数来数。
答题过程
展开
For 0≤x≤40π, there are
40
solutions.
For −10π≤x≤25π, there are
14
solutions.