题目
Problem
Figure 1 shows a sketch of a curve with equation y=f(x).
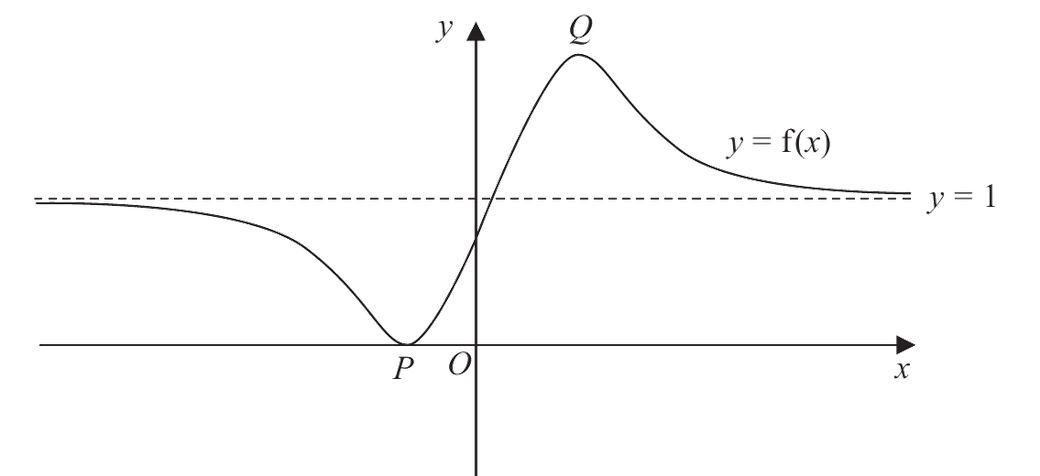
Figure 1
The curve has a minimum at P(−1,0) and a maximum at Q(23,2).
The line with equation y=1 is the only asymptote to the curve.
On separate diagrams sketch the curves with equation
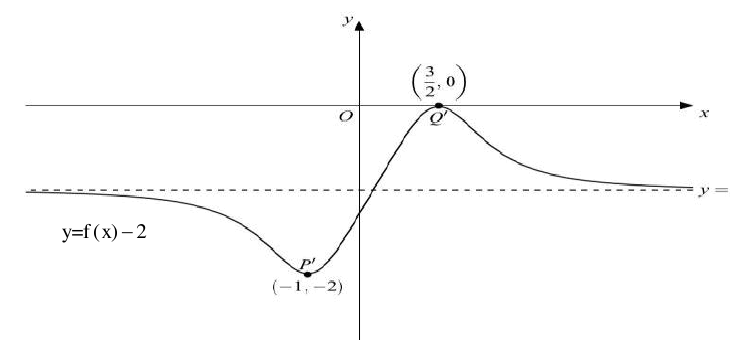
(i) y=f(x)−2
(3)
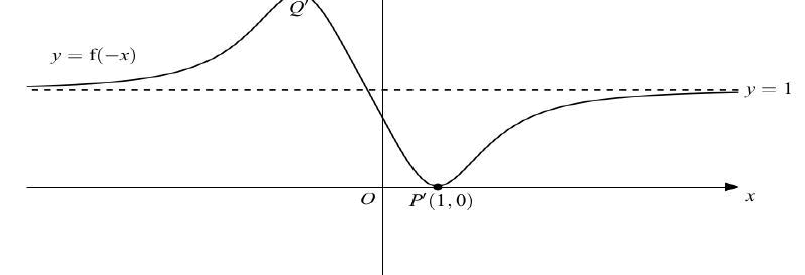
(ii) y=f(−x)
(3)
On each sketch you must clearly state
- the coordinates of the maximum and minimum points
- the equation of the asymptote
题目中文翻译
图 1 所示为曲线 y=f(x) 的示意图。
曲线在 P(−1,0) 处有极小值点,在 Q(23,2) 处有极大值点。
直线 y=1 是该曲线唯一的渐近线。
分别画出下列曲线的示意图:
(i) y=f(x)−2
(ii) y=f(−x)
在每幅图上必须清楚标明:
解答
(i)
解法一
思路
展开
y=f(x)−2 是把原图像整体向下平移 2 个单位。所有点的 x 坐标不变,y 坐标减 2;水平渐近线也向下移 2。
答题过程
展开
The graph of y=f(x)−2 is the graph of y=f(x) translated 2 units down.
The minimum point becomes
P(−1,0)↦(−1,−2).
The maximum point becomes
Q(23,2)↦(23,0).
The asymptote becomes
y=1−2=−1.
(ii)
解法一
思路
展开
y=f(−x) 是关于 y 轴反射。每个点的 x 坐标变号,y 坐标不变。水平渐近线不变。
答题过程
展开
The graph of y=f(−x) is the reflection of y=f(x) in the y-axis.
The minimum point becomes
P(−1,0)↦(1,0).
The maximum point becomes
Q(23,2)↦(−23,2).
The asymptote remains
y=1.