
题目
The stem and leaf diagram below shows the ages (in years) of the residents in a care home.
Key: is an age of 43
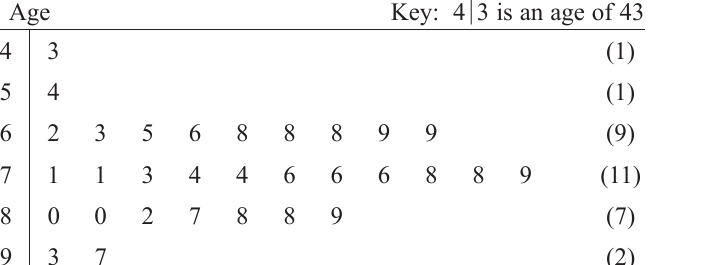
(a) Find the median age of the residents.
(b) Find the interquartile range (IQR) of the ages of the residents.
An outlier is defined as a value that is either more than below the lower quartile or more than above the upper quartile.
(c) Determine any outliers in these data. Show clearly any calculations that you use.
(d) On the grid on page 5, draw a box plot to summarise these data.

解答
(a)
解法一
思路
展开
共有 30 个数据,中位数是第 15 个与第 16 个数据的平均值。
答题过程
展开
There are values, so the median is the mean of the 15th and 16th values.
From the stem and leaf diagram, both are .
Therefore the median is
(b)
解法一
思路
展开
下四分位数和上四分位数分别是下半部分和上半部分的中位数。
答题过程
展开
From the ordered data,
Hence
(c)
解法一
思路
展开
先算离群值边界,再检查数据里是否有低于下界或高于上界的值。
答题过程
展开
The lower boundary is
The upper boundary is
Outliers are values less than or greater than .
Therefore the only outlier is
(d)
解法一
思路
展开
箱线图的盒子用 、中位数 、。因为 43 是离群值,所以左须画到非离群最小值 54,右须画到 97。
答题过程
展开
Draw a box from to , with the median line at .
Draw whiskers to and , and show separately as an outlier.