Skip to content
CalcGospel 國際數學圖譜
返回

IAL 2021 Jan Q5

A Level / Edexcel / S1

IAL 2021 Jan Paper · Question 5

题目

Problem

A company director wants to introduce a performance-related pay structure for her managers. A random sample of 15 managers is taken and the annual salary, yy in £1000, was recorded for each manager. The director then calculated a performance score, xx, for each of these managers.

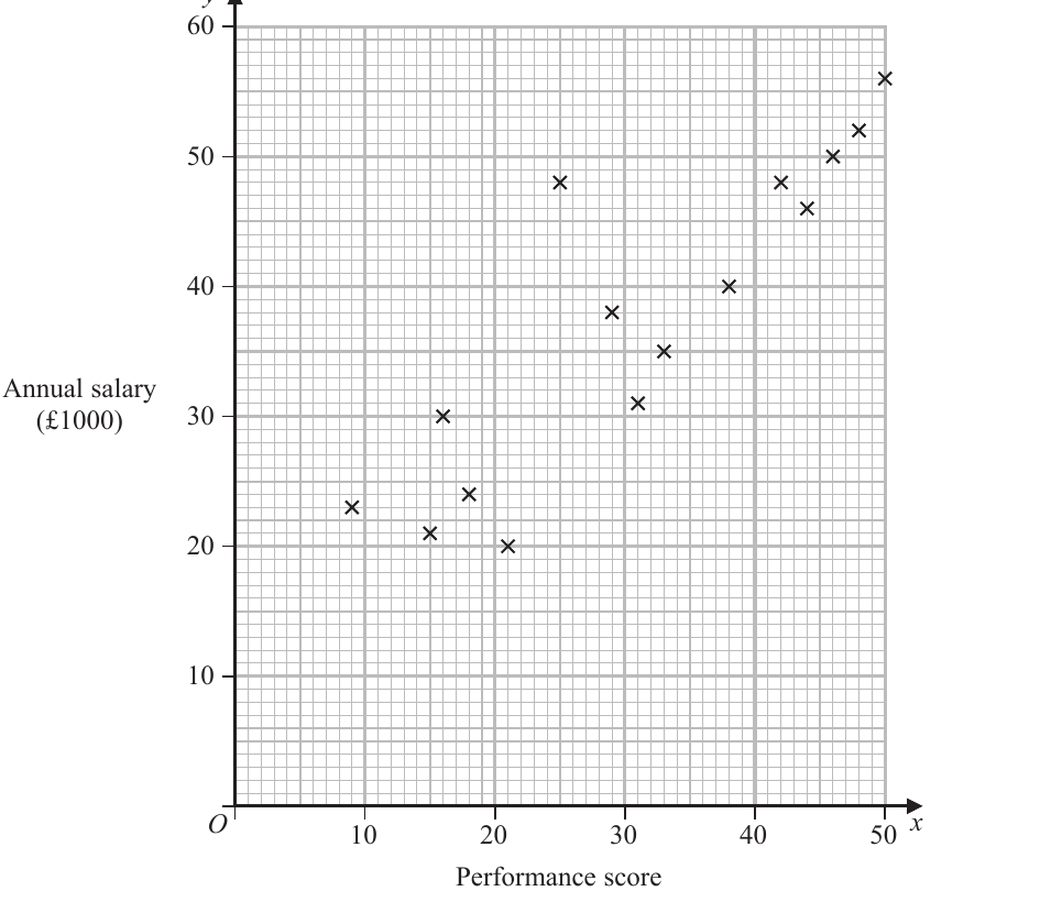
The results are shown on the scatter diagram in Figure 1 on the next page.

(a) Describe the correlation between performance score and annual salary.

(1)

The results are also summarised in the following statistics.

x=465y=562Sxx=2492y2=23140xy=19428\sum x=465\qquad \sum y=562\qquad S_{xx}=2492\qquad \sum y^2=23140\qquad \sum xy=19428

(b) (i) Show that Sxy=2006S_{xy}=2006

(1)

(ii) Find SyyS_{yy}

(2)

(c) Find the product moment correlation coefficient between performance score and annual salary.

(2)

The director believes that there is a linear relationship between performance score and annual salary.

(d) State, giving a reason, whether or not these data are consistent with the director’s belief.

(1)

(e) Calculate the equation of the regression line of yy on xx, in the form y=a+bxy=a+bx Give the value of aa and the value of bb to 3 significant figures.

(4)

(f) Give an interpretation of the value of bb.

(1)

(g) Plot your regression line on the scatter diagram in Figure 1

(2)

The director hears that one of the managers in the sample seems to be underperforming.

(h) On the scatter diagram, circle the point that best identifies this manager.

(1)

The director decides to use this regression line for the new performance related pay structure.

(i) Estimate, to 3 significant figures, the new salary of a manager with a performance score of 30

(2)

解答

(a)

解法一

思路

展开

散点整体向右上方走,所以是正相关。

答题过程

展开

There is positive correlation.

(b)

解法一

思路

展开

Sxy=xyxynS_{xy}=\sum xy-\frac{\sum x\sum y}{n}Syy=y2(y)2nS_{yy}=\sum y^2-\frac{(\sum y)^2}{n}

答题过程

展开 Sxy=xyxyn=19428465(562)15=1942817422=2006.\begin{aligned} S_{xy} =&\,\sum xy-\frac{\sum x\sum y}{n}\\ =&\,19428-\frac{465(562)}{15}\\ =&\,19428-17422\\ =&\,2006. \end{aligned}

Hence Sxy=2006S_{xy}=2006, as required.

Also,

Syy=y2(y)2n=23140562215=2083.733.\begin{aligned} S_{yy} =&\,\sum y^2-\frac{(\sum y)^2}{n}\\ =&\,23140-\frac{562^2}{15}\\ =&\,2083.733\ldots. \end{aligned}

So

Syy=2080to 3 significant figures.\begin{align*} S_{yy}=2080\quad\text{to 3 significant figures}. \end{align*}

(c)

解法一

思路

展开

直接代入 r=SxySxxSyyr=\frac{S_{xy}}{\sqrt{S_{xx}S_{yy}}}

答题过程

展开 r=SxySxxSyy=20062492(2083.733)=0.880310.\begin{aligned} r =&\,\frac{S_{xy}}{\sqrt{S_{xx}S_{yy}}}\\ =&\,\frac{2006}{\sqrt{2492(2083.733\ldots)}}\\ =&\,0.880310\ldots. \end{aligned}

Therefore

r=0.880to 3 significant figures.\begin{align*} r=0.880\quad\text{to 3 significant figures}. \end{align*}

(d)

解法一

思路

展开

rr 很接近 1,表示强正相关,支持线性关系的说法。

答题过程

展开

Yes. The data are consistent with the director’s belief because r=0.880r=0.880, which indicates strong positive correlation.

(e)

解法一

思路

展开

回归线 y=a+bxy=a+bx 中,b=SxySxxb=\frac{S_{xy}}{S_{xx}},再用 (xˉ,yˉ)(\bar x,\bar y) 求截距 aa

答题过程

展开 b=SxySxx=20062492=0.80497.\begin{align*} b=\frac{S_{xy}}{S_{xx}}=\frac{2006}{2492}=0.80497\ldots. \end{align*}

Also,

xˉ=46515=31,yˉ=56215=37.466.\bar x=\frac{465}{15}=31,\qquad \bar y=\frac{562}{15}=37.466\ldots.

Since the regression line passes through (xˉ,yˉ)(\bar x,\bar y),

a=yˉbxˉ.\begin{align*} a=\bar y-b\bar x. \end{align*}

Therefore

a=37.466(0.80497)(31)=12.512.\begin{align*} a=37.466\ldots-(0.80497\ldots)(31)=12.512\ldots. \end{align*}

Hence the regression line is

y=12.5+0.805x.\begin{align*} y=12.5+0.805x. \end{align*}

(f)

解法一

思路

展开

yy 的单位是 £1000,所以斜率 0.8050.805 表示每多 1 分,工资大约增加 0.805×10000.805\times1000 pounds。

答题过程

展开

For each increase of 1 in performance score, the annual salary is expected to increase by about

0.805×1000=805\begin{align*} 0.805\times1000=805 \end{align*}

pounds.

(g)

解法一

思路

展开

画线时取两个容易落在图上的点,例如 x=10x=10x=50x=50,连起来即可。

答题过程

展开

Using y=12.5+0.805xy=12.5+0.805x,

y(10)=12.5+0.805(10)=20.55,\begin{align*} y(10)=12.5+0.805(10)=20.55, \end{align*}

and

y(50)=12.5+0.805(50)=52.75.\begin{align*} y(50)=12.5+0.805(50)=52.75. \end{align*}

Plot the line through approximately (10,20.6)(10,20.6) and (50,52.8)(50,52.8).

(h)

解法一

思路

展开

Underperforming 表示表现分数相对 salary 偏低,图上应找工资较高但 performance score 明显偏低的点。

答题过程

展开

Circle the point

(25,48).\begin{align*} (25,48). \end{align*}

(i)

解法一

思路

展开

x=30x=30 代入回归线。注意 yy 的单位是 £1000。

答题过程

展开

Using the regression line,

y=12.5+0.805(30)=36.65.\begin{align*} y=12.5+0.805(30)=36.65. \end{align*}

Since yy is in £1000, the estimated salary is

£36650.\begin{align*} £36650. \end{align*}

To 3 significant figures, this is

£36700.\begin{align*} £36700. \end{align*}