
题目
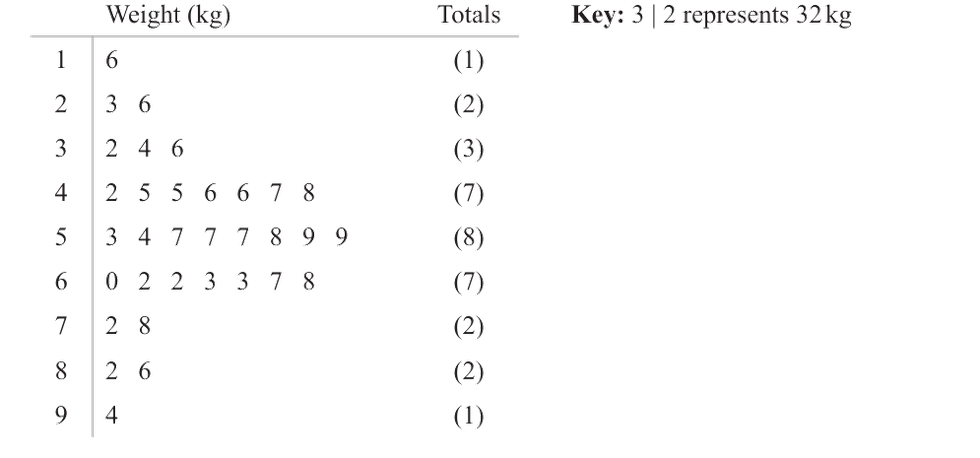
The weights, to the nearest kilogram, of a sample of red kangaroos taken in December are summarised in the stem and leaf diagram below.
(a) Find
(i) the value of the median
(ii) the value of and the value of
for the weights of these red kangaroos.
For these data an outlier is defined as a value that is
greater than
or smaller than
(b) Show that there are outliers for these data.
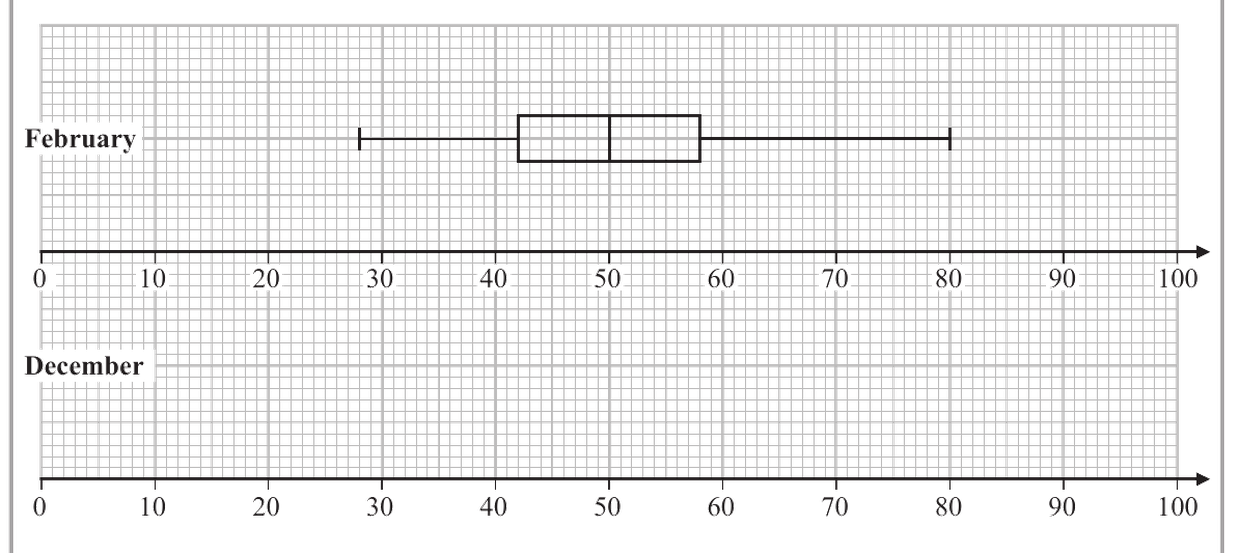
Figure 1 on page shows a box plot for the weights of the same red kangaroos taken in February, earlier in the year.
(c) In the space on Figure 1, draw a box plot to represent the weights of these red kangaroos in December.
(d) Compare the distribution of the weights of red kangaroos taken in February with the distribution of the weights of red kangaroos taken in December of the same year. You should interpret your comparisons in the context of the question.
解答
(a)
解法一
思路
展开
共有 个数据,所以中位数是第 个。下四分位数是前 个数据的中位数,即第 和第 个的平均;上四分位数是后 个数据的中位数,即第 和第 个的平均。
答题过程
展开
There are values.
The median is the th value, so
For the lower quartile,
For the upper quartile,
(b)
解法一
思路
展开
先算四分位距 ,再算上下界。比下界小或比上界大的数据就是 outlier。
答题过程
展开
The upper outlier boundary is
The lower outlier boundary is
The values outside these boundaries are
Therefore there are outliers.
(c)
解法一
思路
展开
画 December 的 box plot 时,箱体用 、median 、。由于 和 是 outliers,须单独标出;须把 whiskers 画到非 outlier 的最小值和最大值,也就是 与 。
答题过程
展开
For December, draw the box plot using:
(d)
解法一
思路
展开
比较两个 box plot,至少要比较一个平均水平和一个离散程度,并且要放回红袋鼠体重的语境中说。
答题过程
展开
The median weight in February is lower than the median weight in December. This suggests that, on average, the red kangaroos weighed less in February than in December.
The interquartile range in February is lower than the interquartile range in December. This suggests that the weights of the red kangaroos were less varied in February.